
We have more sources of data and “news” today than ever before. But, as with all great power comes great responsibility, so we need to ensure we are applying critical thinking skills around all this available information. When reviewing a “study” or evaluating a data set or news item, consider the following:
- How robust is the quality of the data? For example, in assessing consumer behavior, is the study measuring actual point-of-sale (POS) data to assess purchase trends and velocity? Or is the study using qualitative direction, or self-reported actions without verification, to make critical recommendations & decisions?
- Has the data been reviewed and considered from different angles? Is the information seeking diverse points of view and perspectives to ensure we don’t get caught into a “group think” mentality?
- Is the data request or study seeking information to make an informed decision, or filtering information, even skewing it, to try and support a narrative that has already been formed?
Often times data is used to help support a narrative or position, and especially in those instances, it is critical to challenge the foundation of the research. Data can be manipulated to show whatever we want, but if we’re seeking the truth and to make the best decisions based on fact, we should seek to create the best quality data…regardless of the end result. One of the most famous examples of data manipulation to support a pre-conceived narrative is Dr. Ancel Keys’ famous seven countries study that attempted to correlate countries whose inhabitants consumed high amounts of saturated fats with an increase in heart disease. That landmark study was used to formulate a direction that has demonized fats and celebrated carbohydrates for the last 60+ years, which has been proven to be a misguided path. It’s not a coincidence that Type II Diabetes, Heart Disease, Obesity, Inflammation and other factors related to insulin resistance and poor dietary choices have exploded since the 1970’s behind this flawed information, and now represents a global epidemic.
In that spirit, I’ve recently read two examples of “data-based” stories that reinforce how a poor recommendation can be made using flawed data. Let’s review.
Example 1: Vegetarian Health Markers
https://medicalxpress.com/news/2021-05-vegetarians-healthier-disease-markers-meat-eaters.html
In the above article, the title implies vegetarians, and their diets, are healthier than meat eaters. The article proceeds to explain the research that was conducted, including a robust sample size over several years, and how researchers sought to isolate variables so better correlations could be drawn. Sounds promising. The researchers then proceed to share their observational data from their analysis, comparing groups and their 19 biomarkers, suggesting the dietary advantages of a vegan diet.
Here’s where the problems become glaring. First, notice the broadness of that claim (ie, anyone who is vegan vs. anyone who eats meat). Second, it’s not until the very end of the article that the quality of the data becomes clear:
The authors point out that although their study was large, it was observational, so no conclusions can be drawn about direct cause and effect. They also note several limitations including that they only tested biomarker samples once for each participant, and it is possible that biomarkers might fluctuate depending on factors unrelated to diet, such as existing diseases and unmeasured lifestyle factors. They also note they were reliant on participants to report their dietary intake using food frequency questionnaires, which is not always reliable.
Ask yourself: If you were going to make a dietary lifestyle decision, would you be comfortable making that decision based on this data that:
- Was only observational, and relied on end users to self report their dietary intake from a questionnaire
- Only tested one biomarker sample without any consideration on drivers that could cause fluctuation
- Did not consider pre-existing conditions or life factors
- Broadly lumped people into meat vs. non-meat, without any consideration of the multitude of levels in between
If there was a desire to compare different dietary behaviors, and the impact of those diets, proper testing, variable isolation, controls over eating (vs. self-reporting), consistent monitoring/testing and randomization would all be better ways to assess a hypothesis. As an example, see the below link for the results of a test of the effectiveness of low-carbohydrate diets vs. low-fat diets:
Example 2: The Income Tax Gap
In our bizarro world of politics, the current administration is seeking to raise taxes “only on the rich” because representatives from the administration openly claim the wealthy do not pay their fair share of taxes, implying the rich are skirting tax payments while an increasing burden is falling to the lower income earners. I’m not sure there are many people who would argue such a behavior would be unfair, so it would seem like a good idea to ensure the wealthy pay their fair share. But, while I’m sure there are some wealthy who find ways to get around paying taxes, is the narrative that the rich (in general) do not pay their fair share of income taxes really true? Do we have data to validate or disprove this narrative? We do.
During the Obama administration, when taxes were increased, we can compare data from 2014 to 2017 to understand the percentage of income earned by income group and compare that to the percentage of income tax paid by income group.
In 2014. the top 5% of earners accounted for 36% of income, but paid 60% of income taxes. Compare this to the bottom 50%(!) of earners, who accounted for 11% of income but paid just 3% of total income taxes.

In 2017, reviewing similar data, the top 5% of earners were responsible for 36% of income, but paid 59% of income taxes, while the bottom 50% earned 11% of income and paid just 3% of taxes.
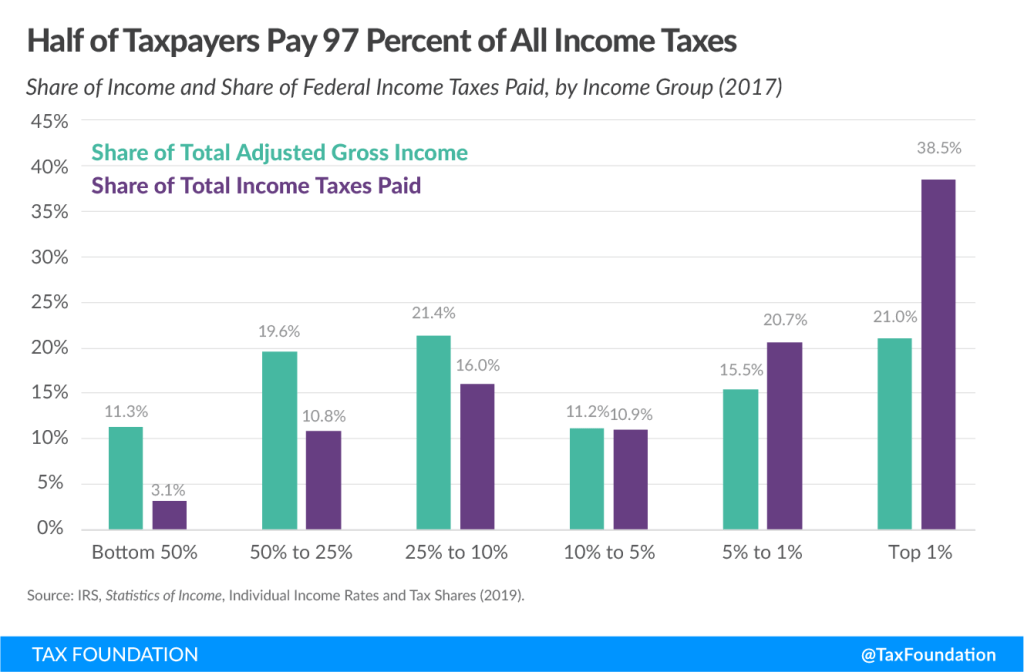
Now, let’s move to tax year 2018, the first year of tax cuts introduced under the Trump administration, and compare the data to 2017. In 2018, with a lower tax plan, the top 5% of earners represented 36.5% of income but actually paid just over 60% of taxes, a higher percentage than in 2017. Meanwhile, the bottom 50% of earners saw their share of income rise slightly (11.25% to 11.61%), but still paid just under 3% of income taxes.
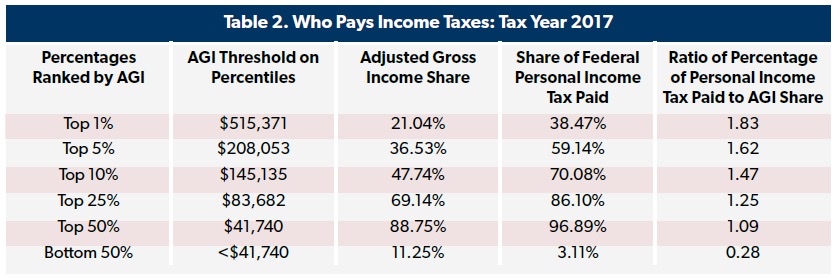
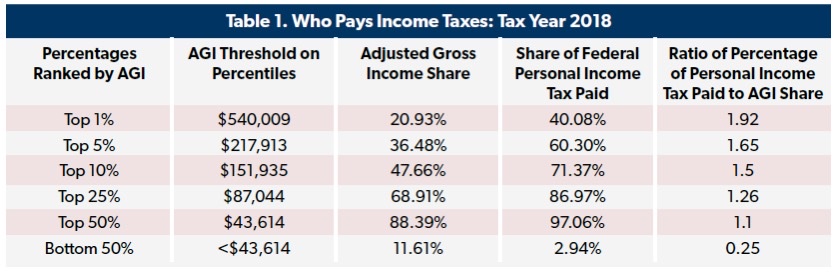
The attached article outlines this comparison in more detail, but looking at three data points, it’s clear there does not seem to be an inequity of the rich not paying “their fair share” when it comes to income taxes. We may want to see the bottom 50% of the population represent more than 11% – 12% of gross income, and seek pathways to increase their income-generating capabilities, which would be a different objective and require a different approach. However, the narrative that the rich are not generally paying their fair share of income taxes is false, backed by years of data, and politicians using a flawed and clearly inaccurate narrative around taxation inequity favoring the rich is simply misleading.
https://www.ntu.org/foundation/tax-page/who-pays-income-taxes
Final Thoughts
We have almost an infinite ability to collect data today, but even though the methods & tools to collect are much more robust, the fundamentals around the objective and the methodology have not changed. Start with a clear objective in mind, and decide how the testing results will help you in your decision-making.
- A good rule of thumb to use is the more scientific and quantitative the test/data, the more expensive, and the more the results should be used to make important decisions. This is where controls over stimulus & variables and eliminating test subject manipulation (ie, blind/placebo) should be tight and consistent.
- The more qualitative, or small-scale experiential, the more those results should be used for directional or guidance decisions. You may have more flexibility in these types of tests, as you’re assessing or comparing attributes, clarifying direction or language, or simply seeking personal perspectives that may enhance a positioning.
- Regardless, pay attention to the quality of the data source, and importantly, do not let a pre-conceived narrative skew your direction. It’s absolutely fair to start with a hypothesis, but don’t skew a test or data collection on the road to only supporting your point-of-view.
Just as integrity is so important in your personal life, make sure your news, research and analyses are based on data integrity.

This is a brilliant evidence-based article! Impressive! This could be submitted to the Wall Street Journal!
Sent from my iPhone
>
LikeLike